Long read lead management
Lead Management Metrics and Reporting for Sales Leaders
Leading metrics catch problems early; lagging ones only confirm what already went wrong.
Most sales dashboards are full of numbers that only tell you what already happened. This piece is about the split that actually matters: leading metrics that catch a problem while there's still time to fix it, versus lagging metrics that just confirm the damage after the quarter's already closed. Get that distinction wrong, or don't make it at all, and your reporting stack turns into a scoreboard nobody can act on.
McKinsey's research on data-driven sales orgs found revenue gains in the 2 to 5% range and productivity boosts as high as 20%, but that only holds if the metrics being tracked are the right ones. Tracking lead volume and email sends because they're easy to pull produces a dashboard that looks busy and tells you nothing. This is for the sales leader staring down a wall of KPIs, trying to figure out which ones deserve a Monday morning huddle and which ones deserve to be quietly archived.
The structural difference between a leading and a lagging metric in the context of lead management
Lagging metrics are outputs. Closed revenue, quota attainment, won deals, these tell you how the period went, and they're the right numbers for accountability. But by the time a lagging metric shows a problem, the problem is already baked in. You can't un-lose a deal that closed last Tuesday.
Leading metrics work differently. They're inputs and in-process signals, things like response time, pipeline velocity, and stage conversion, and they appear early enough that someone can still act on them. The test is simple: if this number moves today, can you act on it before the quarter ends? Yes means leading. No means lagging.
The same metric can switch categories depending on where you're standing. Win rate on a single deal is lagging, it's already decided. But win rate tracked by stage, over time, across the whole pipeline? That's a leading signal for the health of the funnel. Context decides the label, not the metric itself.
Dashboards that blend both types without separating them train sales leaders to treat every number as equally urgent. That's not focus, that's noise, and noise causes people to freeze instead of act. Sort out this distinction first, and the rest of the reporting stack falls into place with a lot less arguing in the Tuesday pipeline review.
The leading indicators worth building a reporting stack around
Speed-to-lead is the top of this list for a reason: it's the time between a lead raising their hand and a rep actually calling them, and it's one of the most directly predictive numbers in the whole funnel. Track it as a median across the team, sure, but also track the 90th percentile by rep and by segment. Averages hide slow outliers the way a rug hides a stain, they just move the problem, they don't remove it.
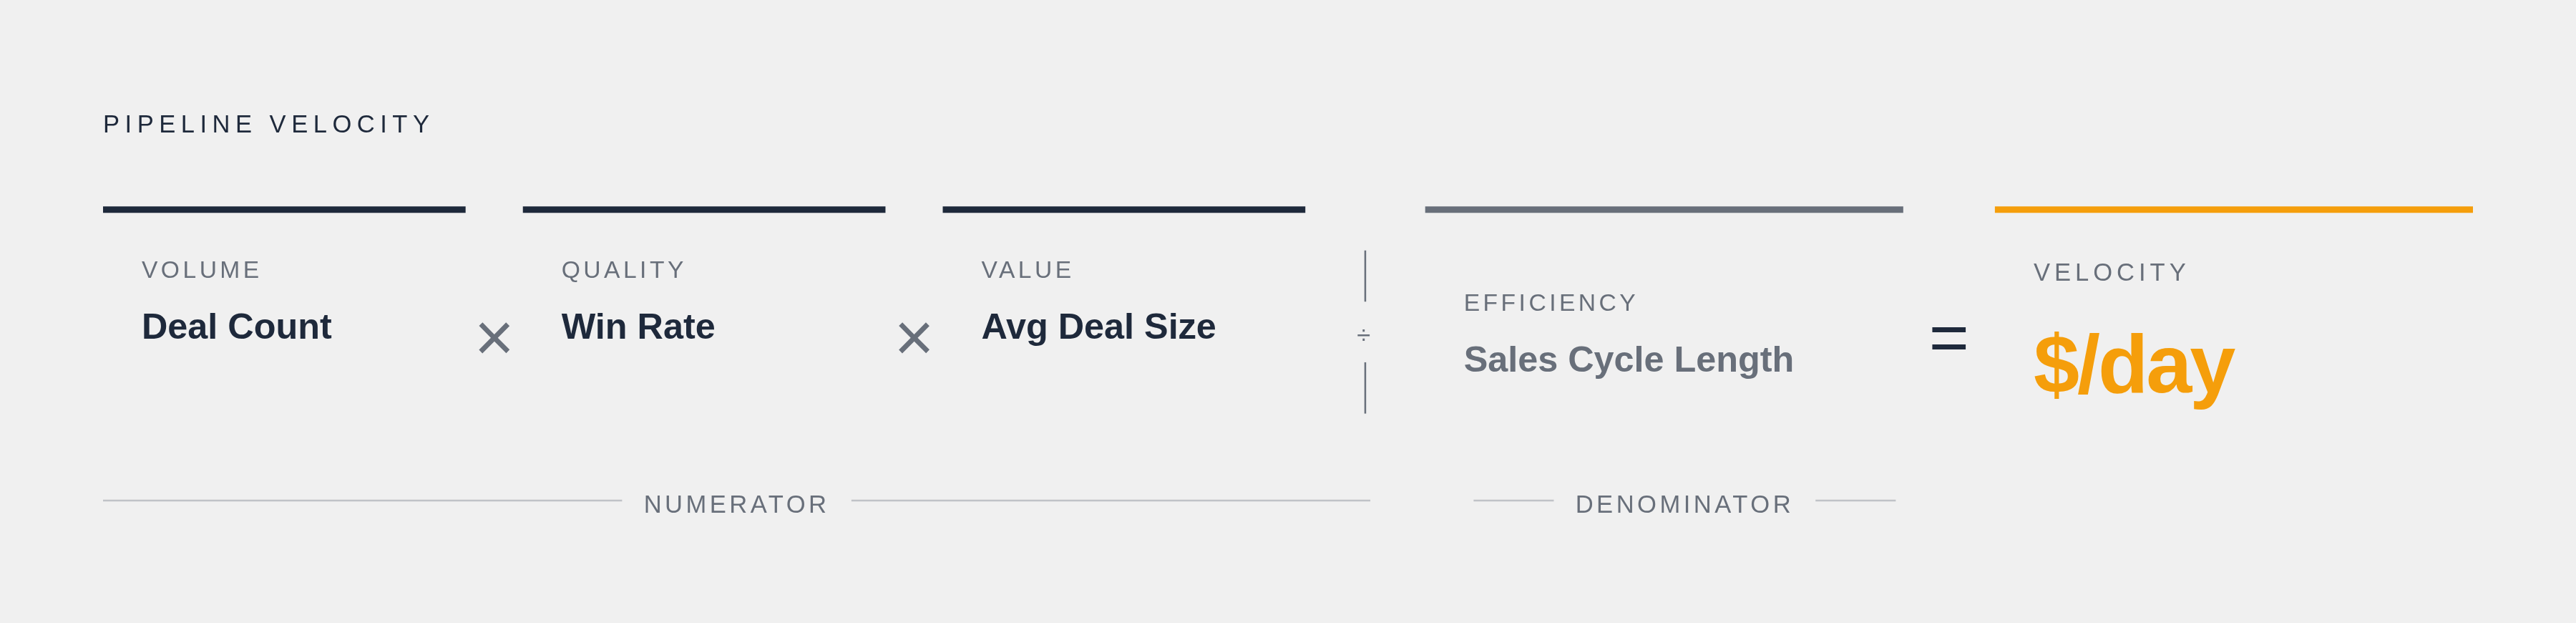
Pipeline velocity is the number that does the most work per square inch. It rolls deal count, win rate, average deal size, and cycle length into one figure that tells you how fast the funnel is actually turning into cash:
(Number of Opportunities × Win Rate × Average Deal Size) ÷ Sales Cycle Length
Run it weekly. A slowdown in deal volume that marketing hasn't even clocked yet appears here first, weeks before it ever hits a financial report.
Lead velocity rate tracks something different: month-over-month growth in qualified pipeline creation. It answers whether the top of the funnel is actually expanding, independent of whether any of those deals have closed yet.
Stage-by-stage conversion rates matter more than the aggregate win rate because they show exactly where deals get stuck. A win rate taken as a single aggregate number tells you almost nothing actionable. A steep drop-off at the proposal stage, appearing consistently across five different reps, tells you the pricing conversation or the proposal template has a hole in it. That's not a coaching problem; it's a process problem wearing a coaching costume.
Lead quality score and lead engagement score round out the leading side. Quality score is a composite, demographic fit, firmographic fit, behavioral signals, and it should be built before a rep ever spends an hour on a lead. Behavioral signals (pricing page visits, multiple downloads, a demo request) carry more predictive weight than firmographic fit alone, and companies using lead scoring have reported gains of up to 70% in lead generation ROI compared to those skipping it. Engagement score tracks the same behavioral trail, opens, downloads, page visits, as a running proxy for buying intent.
MQL-to-SQL conversion rate closes out the leading list, and it deserves its own section, because almost nobody agrees on what it actually measures.
The lagging indicators that still belong in the stack, used correctly
Monthly sales growth, quota attainment, closed revenue: none of these are wrong to track. They're essential for accountability and for telling leadership how the business is doing. The mistake isn't tracking them, it's treating them as the primary steering wheel instead of the rearview mirror they actually are.
Win rate, taken as an overall number, is a lagging output of the entire sales process. Fine for spotting a multi-quarter trend, useless for figuring out why this specific quarter is going sideways in week six.
Average deal size moves slowly enough to count as lagging in any single period, but a sustained quarter-over-quarter decline is worth chasing down. That kind of slide usually points to a pricing issue, a qualification issue, or a shift in deal mix that nobody flagged out loud.
Cost per qualified lead and cost per SQL are lagging in the sense that the money's already spent, but they're the backbone of any channel efficiency conversation. And the true cost isn't just the ad spend. It has to include content production, SDR salaries, the CRM and automation platforms, and overhead, or the number is fiction dressed up as math.
Quote-to-close ratio is lagging at the individual deal level, but tracked historically, it becomes a useful check on whether upstream qualification is actually improving or just feels like it is.
The fix for all of these lagging metrics is the same: pair each one with the leading metric that would have predicted it. Review closed revenue next to pipeline velocity. Review win rate next to stage conversion trends. That pairing is what turns a lagging number from a eulogy into a lesson.
MQL-to-SQL conversion: the metric most teams track without agreeing on what it means
Five sales leaders asked what a good MQL-to-SQL conversion rate looks like will give five different numbers, and the maddening part is they might all be right, for their own business. A product-led company with a free trial and a company selling six-figure enterprise contracts are never going to land on the same benchmark, because their definitions of "qualified" start from completely different places. Chasing an industry average here is like comparing your commute time to someone who lives next door to their office.
The only benchmark that means anything is your own rate, tracked consistently, quarter over quarter.
For B2B companies leaning on behavioral scoring, pricing page visits, demo requests, competitor comparisons, conversion rates tend to run meaningfully higher than for companies scoring on demographic or firmographic fit alone. Behavior predicts intent better than a job title ever will.
The real conversion killer isn't the scoring model though, it's the handoff. When marketing and sales are working from two different definitions of "qualified," every single handoff becomes a small negotiation. Leads sit uncalled. Follow-up slips. Deals that could've closed stall out in a queue nobody owns. This kind of misalignment drives up customer acquisition costs and stalls deals that should be moving. This isn't just friction between two departments who don't love each other, it's a cost line with real numbers attached.
A broken MQL-to-SQL rate is telling you one of two things: either marketing's leads don't meet what sales actually needs, or nobody's ever written down what sales actually needs. Both are fixable. Neither gets fixed while it stays unnamed.
The practical move is to make this conversion rate a shared metric, reviewed by marketing and sales in the same room, on the same dashboard. Not a report marketing hands over for sales to grade like a homework assignment.
Closed revenue, quota attainment, won deals, these tell you how the period went, and they're the right numbers for accountability.
Speed-to-lead as a decision-forcing metric, not a call-center stat
Speed-to-lead earns its spot as a leading indicator for a simple reason: it's controllable today, it predicts conversion directly, and it shows cracks in the data well before conversion rates do. By the time conversion drops, speed-to-lead already tanked weeks ago and nobody was watching.
Tracking a single team average is the trap here. What matters is response time by rep, by segment, and specifically at the 90th percentile, because the outliers are exactly where revenue quietly leaks out the side door. A dashboard showing an "acceptable" average can be masking two reps who call back in ninety seconds and three who let leads sit overnight. The average looks fine. The pipeline does not.
The fix is to stop treating speed-to-lead as a goal and start treating it as a trigger. Set a hard threshold, any inbound SQL uncontacted past that window gets escalated automatically. Not flagged for the next one-on-one three weeks from now. Now.
Pairing this with lead engagement score sharpens the picture fast. A high-engagement lead that's gone untouched past your response threshold isn't a mild concern; it's a five-alarm problem, and the dashboard should surface that combination directly instead of making someone cross-reference two separate tabs to notice it.
Pipeline velocity: reading the one number that predicts revenue before the quarter ends
Total pipeline value lies to you in a specific way: a big number full of stalled, low-probability deals looks reassuring right up until it collapses like a poorly built card tower. Pipeline velocity doesn't have that problem, because it bakes in win rate and cycle length alongside volume, so it reflects quality, not just size.
The four inputs each carry their own signal. Deal count shows volume. Win rate shows quality. Average deal size shows value. Sales cycle length shows efficiency. Any one of these sliding backward appears in velocity long before it appears in a revenue report.
Forecastio's 2026 pipeline management guide cites Gartner data showing organizations with structured pipeline management improving forecast accuracy by as much as 20%. That's not a small edge when the CFO is asking for a number to put in front of the board.
Read velocity as a trend, not a snapshot. One down week is noise. Two or more consecutive weeks of decline is a warning that deserves a real conversation, not a shrug.
Where AI tools are actually earning their keep is here: predictive pipeline software can weight deals by engagement signals and historical close patterns, flag at-risk deals before a rep even notices the deal's gone quiet, and answer plain-language questions like "which deals need attention this week." That's less time spent building reports and more time spent acting on them.
Velocity tells you something's wrong, but it doesn't tell you where. For that, pair it with stage-by-stage conversion. Velocity is the smoke alarm. Stage conversion is the flashlight you use to find the actual fire.
Building a reporting stack that separates decision metrics from review metrics
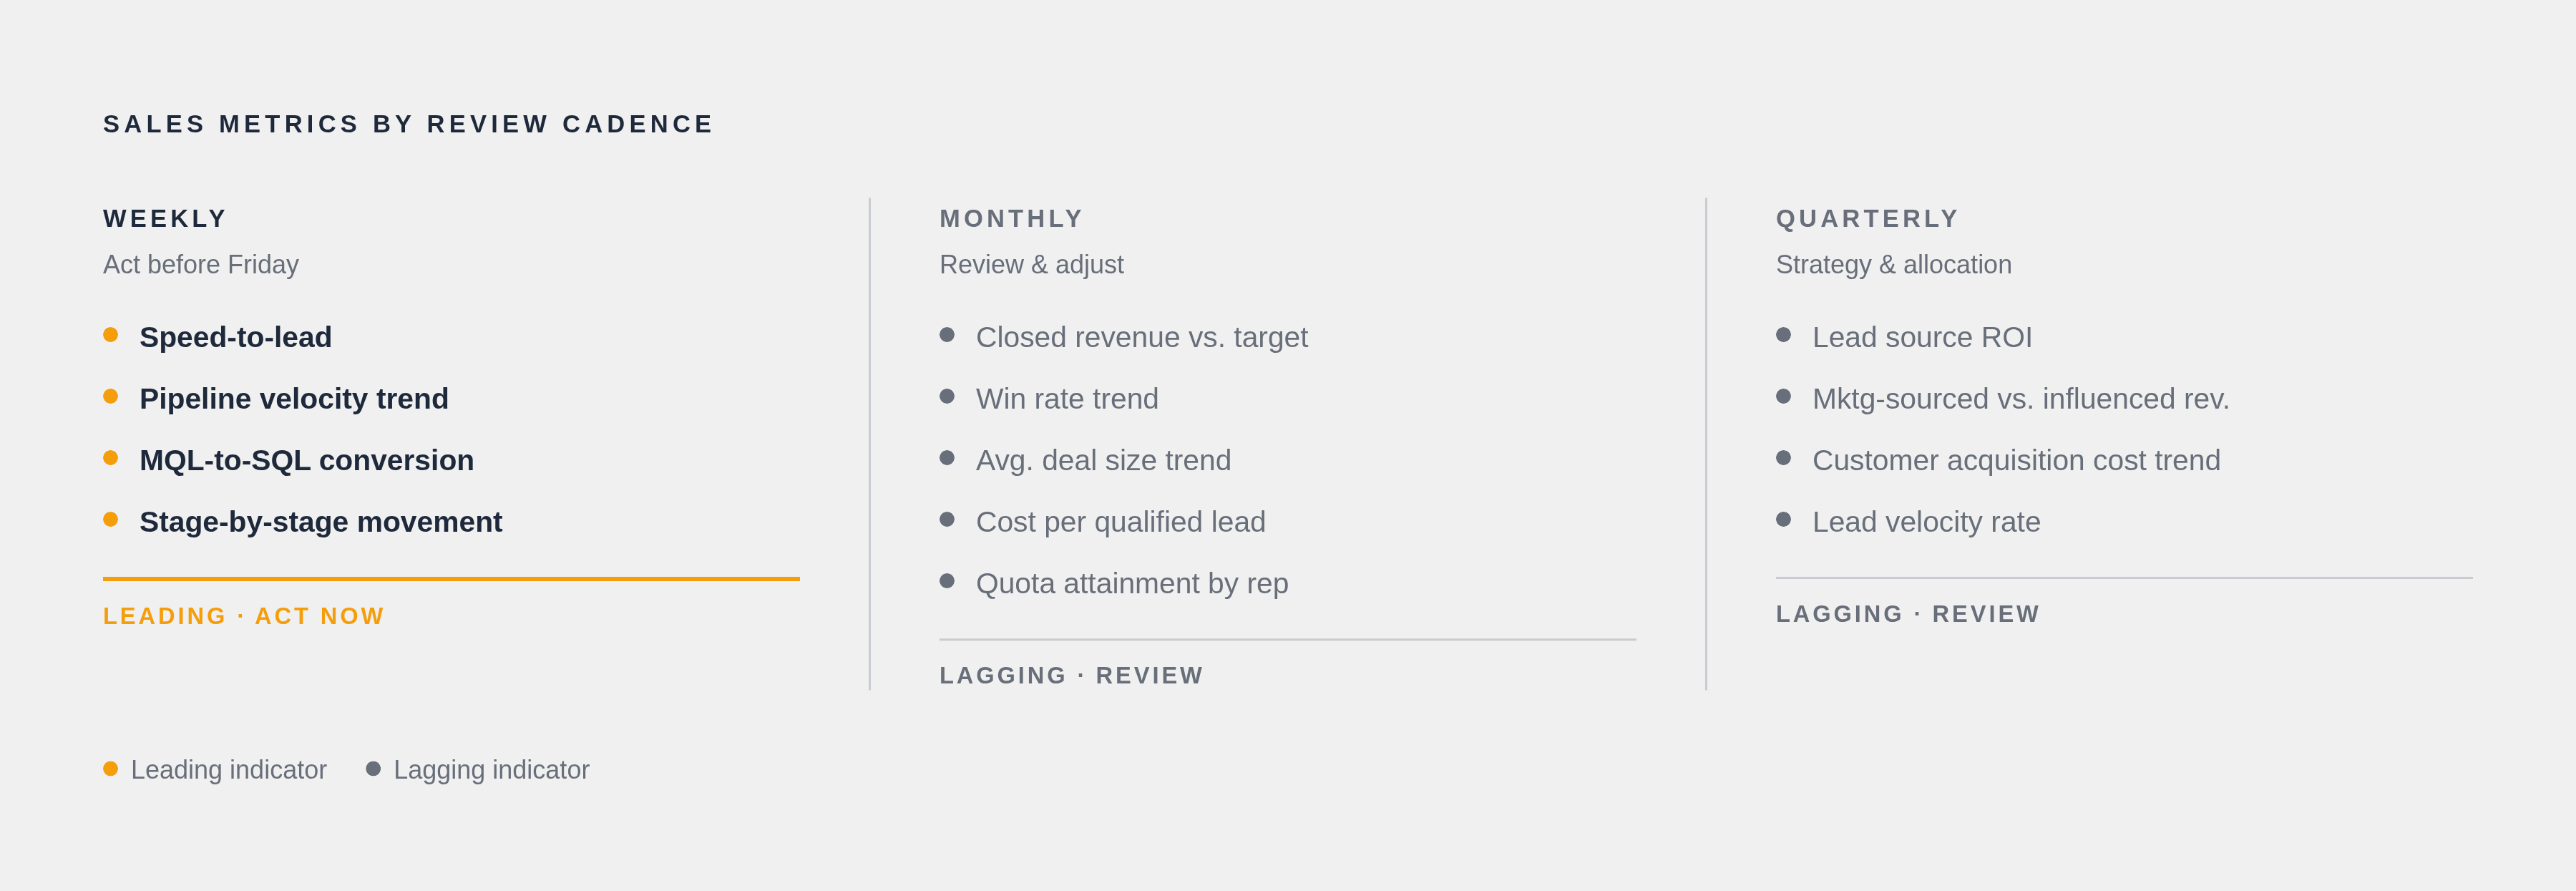
The design principle here is straightforward: leading indicators belong in daily and weekly cadences, lagging indicators belong in monthly and quarterly ones. Mix them into the same view at the same frequency, and the dashboard becomes exhausting instead of useful because the different cadences clash.
A weekly operational dashboard should carry speed-to-lead, the pipeline velocity trend, MQL-to-SQL conversion, and stage-by-stage movement, the things a sales leader can still act on before Friday.
A monthly review dashboard shifts toward closed revenue versus target, win rate trend, average deal size trend, cost per qualified lead, and quota attainment by rep, the numbers that confirm whether last month's weekly decisions actually compounded into something real.
A quarterly strategic review pulls back even further: lead source ROI, marketing-sourced versus marketing-influenced revenue, customer acquisition cost trend, and lead velocity rate across the full quarter, the inputs that inform budget and headcount decisions rather than this week's call list.
MQL-to-SQL conversion and pipeline velocity deserve a special rule: they should show up in both marketing's dashboard and sales's dashboard, jointly owned. Siloed in one team's view, they're a lot less useful, like a smoke detector installed in a room nobody sleeps in.
None of this works on dirty data. Duplicate CRM records, inconsistent stage definitions, missing close dates, a dashboard built on that foundation produces leading indicators that are worse than having no indicators at all, because they look trustworthy while quietly lying. Clean data isn't a nice-to-have upgrade here; it's the entry fee.
AI-assisted querying is changing who gets access to this stuff, too. Asking a system in plain language "which deals are at risk this quarter" is a realistic capability in modern RevOps stacks now, and it means someone without an analytics background doesn't have to wait three days for a report to get the same answer.
Connecting lead management metrics to content and marketing's upstream contribution
Gartner's B2B buying research, cited widely in sources on this topic, puts the buyer's self-directed research at around 60% of the decision journey completed before a salesperson ever enters the conversation. That's the bulk of the deal happening somewhere a rep can't see it, shaped entirely by content and marketing.
A handful of metrics tie that upstream work back to pipeline health: lead source performance (which channels actually produce leads that convert, not just leads that show up), marketing-sourced versus marketing-influenced revenue (which campaigns started the deal versus which ones just helped it along), and content-influenced pipeline tracked as its own attribution category.
Roughly half of B2B marketers report that content directly drives revenue, but most of them struggle to actually prove it with clean attribution. That measurement gap is why marketing budgets get cut first when the business hits a rough quarter; nobody wants to defend a number they can't fully back up.
A well-instrumented stack connects campaign touchpoints to CRM opportunities across the entire sales cycle, not a last-click model that hands all the credit to whichever email happened to land right before the deal closed. Multi-stakeholder B2B deals rarely have a single moment that "did it."
Whether AI answer engines actually cite a company's content when buyers ask relevant questions is an emerging signal worth watching. Call it AI citation share, a rough cousin of search impression share, but for answers generated by AI instead of a ranked list of blue links. It's early, but it's a real upstream signal worth adding to the stack alongside the more familiar search and pipeline numbers.
For a sales leader, a decline in MQL-to-SQL conversion might be a content or qualification-criteria problem rather than a sales process problem. It might be a content or qualification-criteria problem sitting one layer upstream. A good reporting stack makes that connection visible instead of leaving it to get sorted out in a quarterly finger-pointing session.
What a reporting stack built on this distinction changes for a sales leader
The weekly review looks different once this distinction is in place. Instead of opening with what closed last week (fixed, unchangeable, done), the meeting opens with the pipeline velocity trend and the speed-to-lead outliers, the things that can still be nudged before the quarter locks in.
Diagnosis changes too. A drop in closed revenue stops being a gut-punch surprise that kicks off a post-mortem nobody enjoys. It becomes confirmation of a velocity decline or a conversion breakdown that already appeared in the leading indicators five or six weeks earlier, quietly waiting for someone to notice.
And the relationship between marketing and sales shifts in a way that's honestly overdue. When both teams are staring at the same MQL-to-SQL conversion number and the same pipeline velocity trend, owned jointly, on the same dashboard, the conversation stops being "your leads are garbage" versus "your reps don't follow up." It becomes a shared problem with a shared number attached to it, which is a far more useful place to start than two departments shouting past each other from opposite ends of the funnel.
Notes
- Sales Pipeline Management in 2026: Metrics, Pipeline Health, Risk Detection
Provided the Gartner statistic on organizations with structured pipeline management improving forecast accuracy by up to 20%.
- Lead analytics dashboard: 7 metrics every sales team needs in 2026
Provided the figure that companies using lead scoring reported gains of up to 70% in lead generation ROI.
- Top 15 Sales Performance Metrics to Track in 2026
Provided the McKinsey research figures on revenue gains of 2–5% and productivity boosts up to 20% for data-driven sales organizations.
- 16 Lead Generation Metrics That Matter in 2026 - Lead Forensics
Provided context for lead velocity rate as a metric tracking month-over-month growth in qualified pipeline creation.
- https://monday.com/blog/crm-and-sales/what-is-sales-velocity/
Supported the explanation of pipeline velocity and its four-input formula connecting deal count, win rate, deal size, and cycle length.