Essay Sales Forecasting Methods
Bottom-Up vs Top-Down Sales Forecasting in B2B
Both methods expose blind spots the other misses, so run both and reconcile before quarter start.
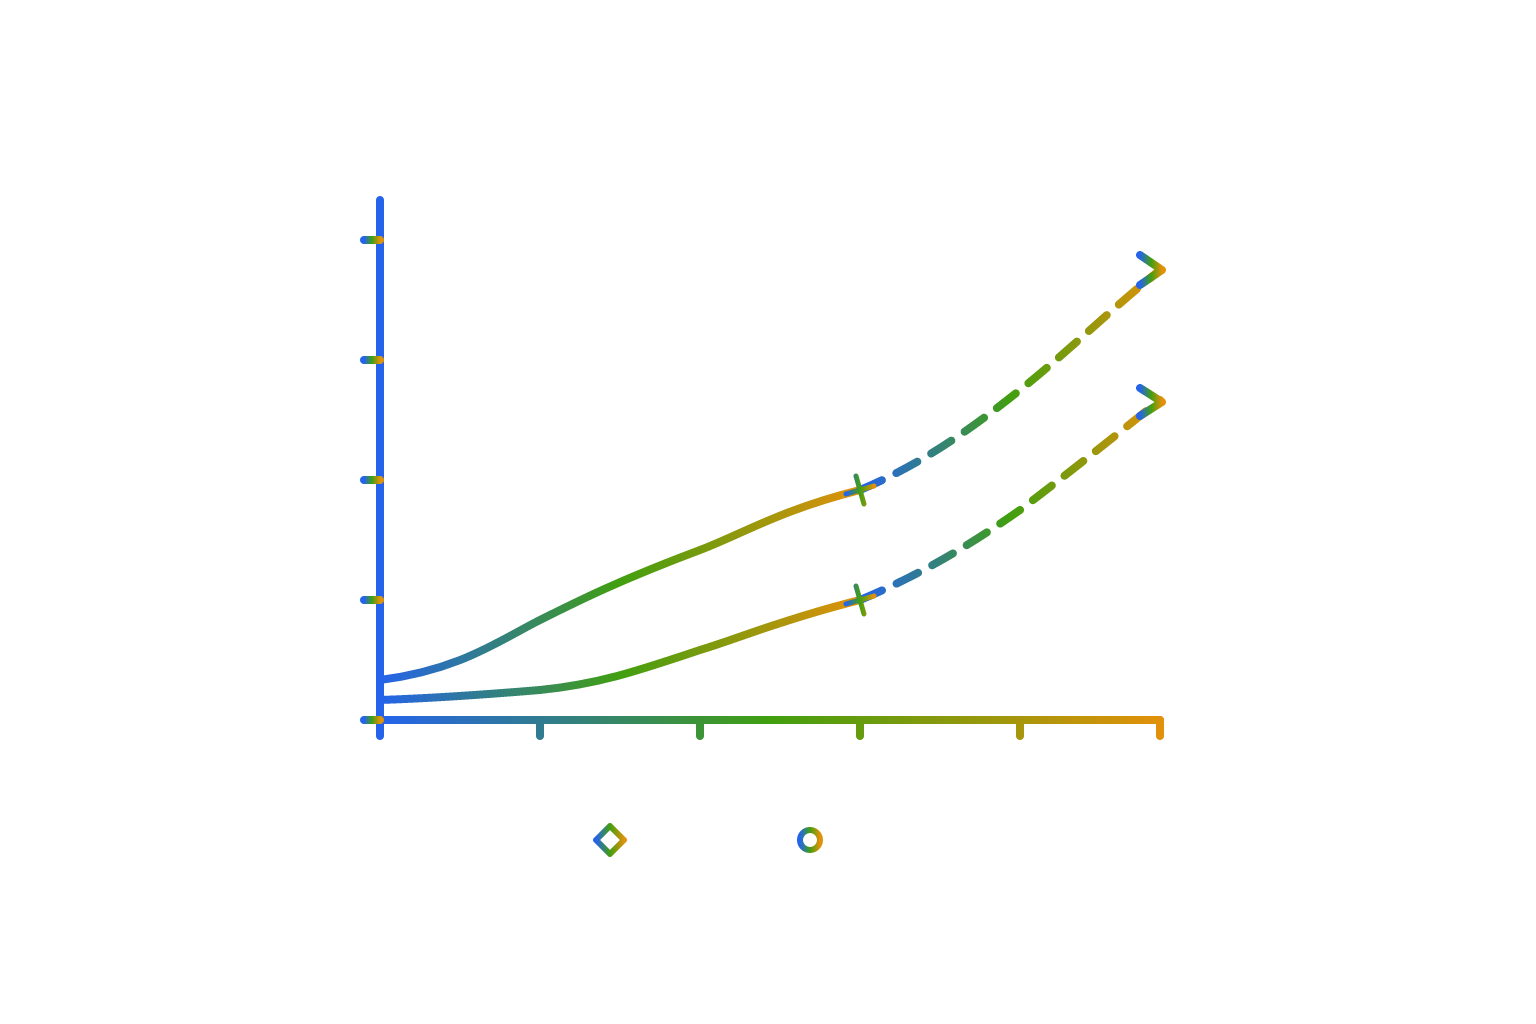
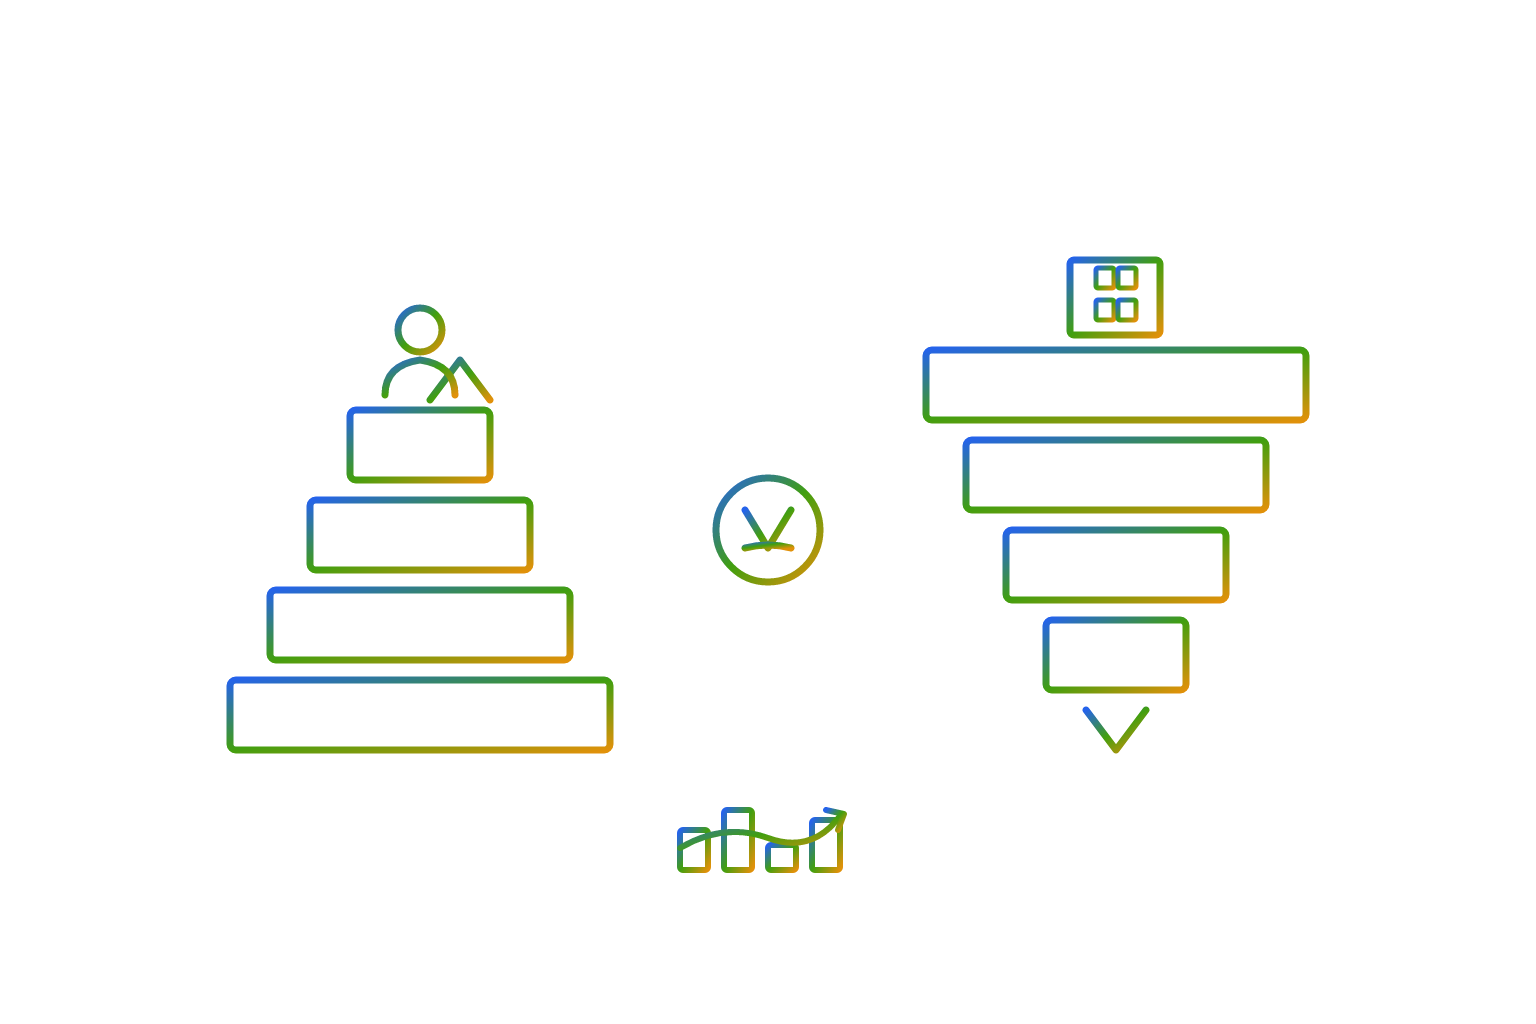
Sales forecasting in B2B typically pulls teams in two directions at once. Finance and leadership want a number anchored to market opportunity and strategic targets. Sales managers and RevOps want a number built from actual pipeline. Bottom-up and top-down forecasting are the two methods that correspond to those needs, and choosing between them is a false choice. Top-down sets the strategic ambition by working from market size, growth rates, or board targets down through regions and reps. Bottom-up builds a forecast from the ground up by aggregating open CRM opportunities and rep commitments into a company total. Each method has structural blind spots the other can correct. The job is to run both, understand where they diverge, and reconcile them into one defensible number before the quarter begins.
Why the two methods answer different questions
The instinct is to pick the more accurate method. But accuracy depends on the question being asked. Top-down forecasting asks what each part of the business must contribute to reach a goal. Bottom-up asks what the current pipeline suggests the business will actually close. Those questions belong in the same planning process, but treating them as interchangeable turns a target into a prediction without doing the work between.
Top-down starts with a macro figure, such as total addressable market, a board target, or last year's revenue multiplied by a growth rate. It then allocates that figure through regions, segments, and reps. The direction suits annual planning, investor models, and new-market entry, where there may be no pipeline to aggregate. Finance and the board typically receive this number because it connects revenue expectations to the broader plan.
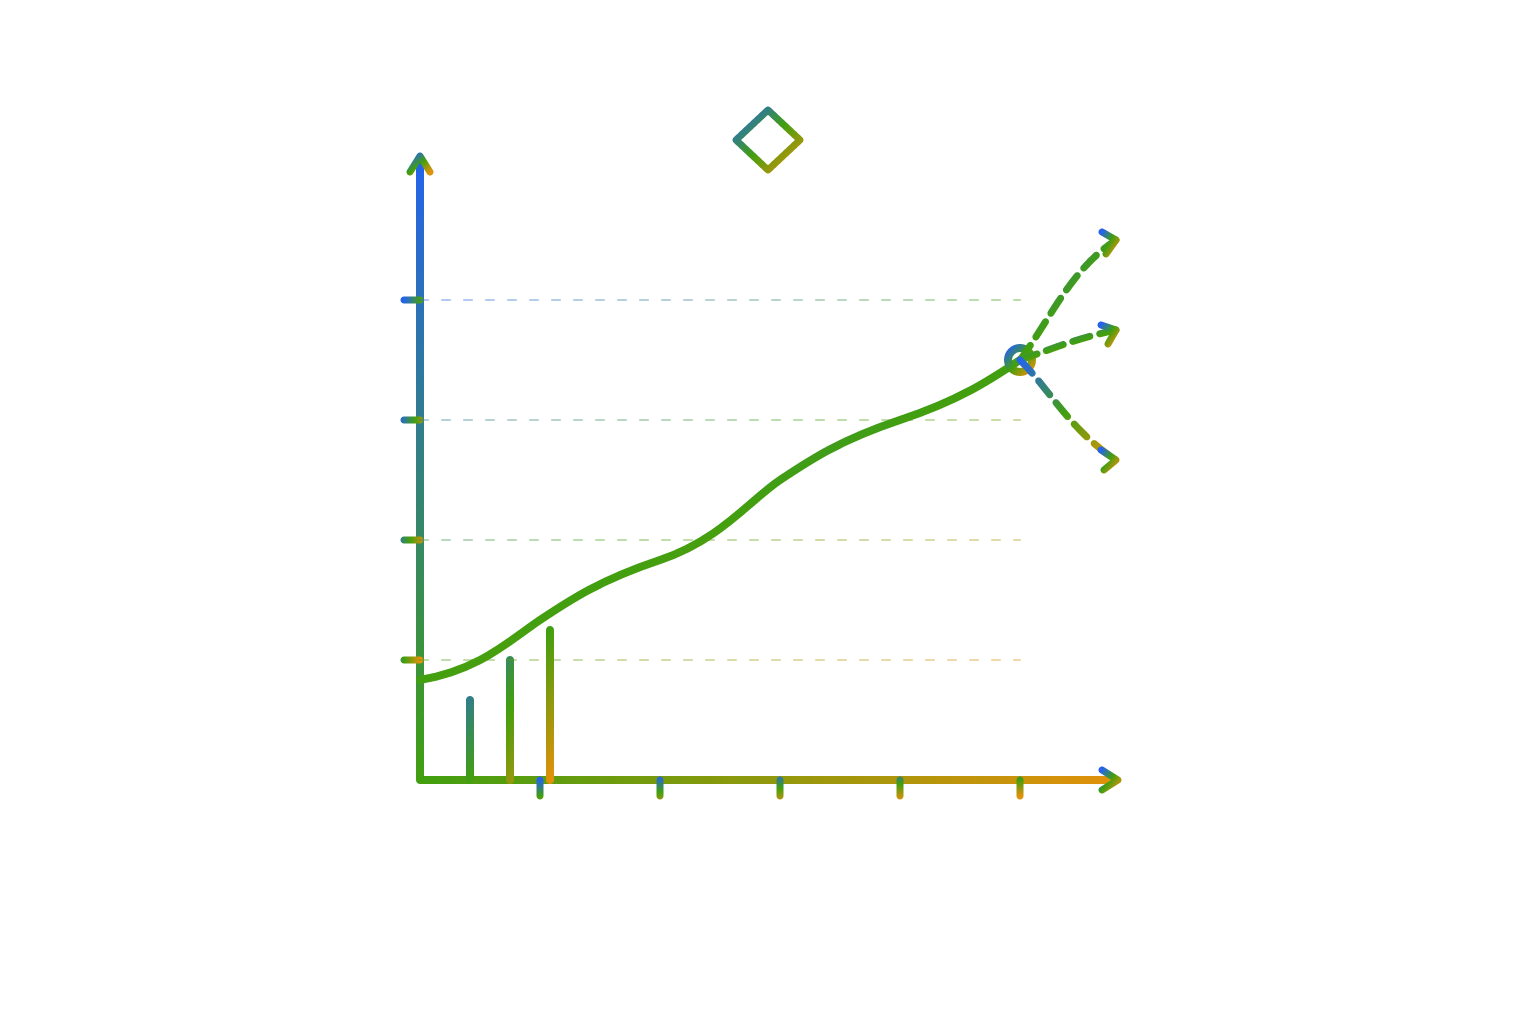
Bottom-up reverses that direction, starting with open CRM opportunities and each rep's committed deals. Managers validate and roll those inputs up to a company total. This makes it a better fit for current-quarter calls and rep accountability, where actual deals show how much revenue is likely to come in. Frontline managers and RevOps work at this level. The distinction is therefore less about rival formulas than about the distance between the decision and the customer.
Where top-down forecasting breaks down
Top-down's central failure is aspiration detached from pipeline reality. A growth rate can allocate revenue neatly without establishing whether the team can produce it. Overestimated market share and outdated market-size data make that problem worse by weakening the starting assumption. Correct division does not make an unreachable market reachable.
The same disconnect appears when a target cascades into quotas. An allocation that assumes uniform performance treats every rep and territory as average, even though their conditions differ. Starting from the desired outcome does not, by itself, test the capacity needed to deliver it.
For pre-revenue and early-stage companies without a usable pipeline, top-down may be the only way to start. But having to use it does not make its assumptions more sound. If growth projections miss lengthening sales cycles visible in deal data, hiring and operational spending can get ahead of revenue, leaving the company with unused capacity and missed investor expectations.
Bottom-up is the natural corrective because it brings deal-level constraints into view. It can show whether the opportunities support the planned revenue and whether their timing fits the forecast period. But proximity to the customer is not a guarantee of truth, especially when the customer's intentions arrive through a rep, a CRM, and several management layers.
Where bottom-up forecasting breaks down
Bottom-up's near-term advantage depends on the quality of its inputs. Those inputs come from people whose incentives and selling habits can distort their assessments. Persistence, conviction, and positive framing help reps sell, but those same traits can produce optimism about deal progress that causes stage advancement to outrun qualification. The forecast inherits that optimism directly.
The opposite distortion is just as predictable. If missing a commit is punished more heavily than under-calling it, reps have a reason to sandbag. Their submissions then reflect both the consequences of being wrong and the likelihood of closing. Neither bias requires a careless or dishonest team. Both arise from how selling works and how forecasting is used.
Incomplete qualification fields leave gaps in deal assessments, while inconsistent stage definitions undermine probability weights across regions. Opportunities also change between updates, making recorded information stale. Some deals remain open long after they should have been closed out, while opportunities created and closed within the quarter are absent from an earlier snapshot. A precise total can therefore include outdated deals and miss revenue that closed quickly.
Rolling that data upward does not fix it on its own. A rep submits an optimistic number, a manager applies a haircut, and a VP adjusts it under board pressure. Without enough closed-deal history, even the stage-level probability weights are guesses with little evidence behind them. Bottom-up adds the deal-level detail that top-down lacks, while top-down gives a deal roll-up the strategic frame it cannot set on its own.
What the gap between totals reveals
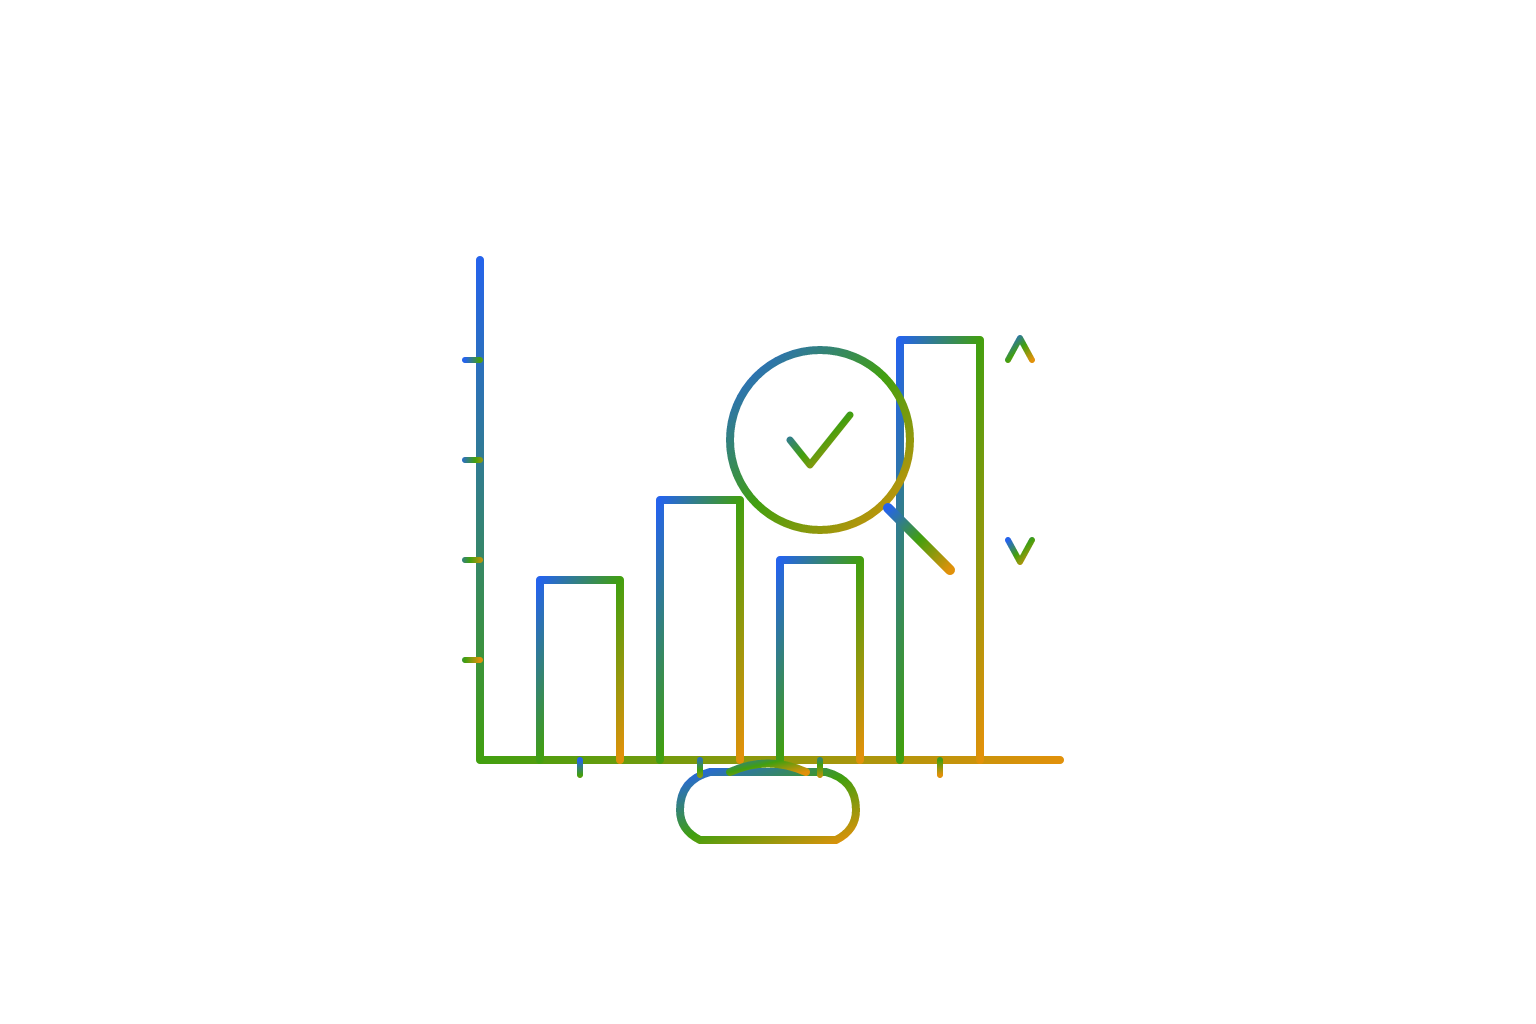
When the two totals disagree, they show where the plan and the pipeline stop agreeing, giving the team something specific to investigate before the quarter starts. Averaging the numbers removes that signal without resolving its cause.
When bottom-up exceeds top-down, stage probabilities may be inflated, or the strategic target may be too conservative. Sandbagging may also warrant examination where rep commitments understate what the underlying opportunities suggest. Those possibilities are not interchangeable. One concerns deal assessment, another concerns ambition, and another concerns how people report expected revenue.
When top-down exceeds bottom-up, the shortfall may reflect insufficient pipeline coverage, weaker win rates, or an aspirational target. Is the business short of market access, pipeline volume, conversion, or rep capacity? Each answer implies a different response, which neither total can supply on its own.
A top-down-only team lacks the operational test, while a bottom-up-only team does not pressure-test its aggregate against the market opportunity. The gap makes the plan's executability discussable. Its value lies in exposing the decision that must be made.
Top-down starts with a macro figure, such as total addressable market, a board target, or last year's revenue multiplied by a growth rate.
How to reconcile pipeline totals with strategic targets
The practical process starts with clean bottom-up inputs. Each opportunity needs a stage, an amount, a close date, and a probability weight derived from historical win rates at that stage. Reps use those rates and what they know about each deal to review their deals before they submit their forecasts. Managers then validate the submissions and roll them up through teams and regions. This establishes an operational estimate before strategic pressure enters the discussion.
Stage definitions must be consistent across that roll-up. If "Proposal Sent" means different things in different territories, applying the same probability weight creates apparent consistency. Shared labels are not enough on their own. The underlying deal conditions must support the weight attached to them, or the aggregate begins with a measurement problem that management adjustments cannot reliably fix.
The top-down input is established separately from the strategic target. A revenue goal or market estimate is split across segments based on past growth rates, assumptions about capacity, and estimates of market share. Total addressable market is refined to serviceable available market and serviceable obtainable market, which narrows the estimate to an opportunity the team can realistically access and win.
With both inputs established, the gap becomes explicit. The team categorizes it as a pipeline coverage, conversion, capacity, or strategic-assumption problem rather than debating which department owns the more persuasive spreadsheet. Clean bottom-up evidence constrains how far the forecast can credibly move toward the top-down ambition. A genuine market opportunity not yet represented in the pipeline turns the coverage shortfall into an action item, but the opportunity alone is not enough to convert the target into expected revenue.
A defined reconciliation cadence brings sales, RevOps, and finance together to resolve those differences under explicit rules. This is where they align on a single forecast and make its tradeoffs visible. Bottom-up provides the operational grounding, top-down provides the strategic constraint, and the agreed number reflects what the evidence supports. Any unresolved distance to the goal remains a planning problem requiring a response.
Where AI improves the reconciliation process
AI fits into this process as a correction layer. Its role is to improve the deal evidence on which reconciliation depends by addressing incomplete qualification, inconsistent stage application, and stale data. It can distinguish evidence-backed assessments from rep sentiment and flag disengagement patterns before a deal slips out of the quarter. It can also calibrate stage probabilities to the team's historical win and loss patterns.
Better deal inspection makes a bottom-up total more defensible, which in turn makes the gap against the strategic target easier to interpret. AI does not establish whether the company's ambition is appropriate, nor does it remove the need for sales, RevOps, and finance to resolve competing assumptions. A cleaner input still requires an organizational decision about what the forecast will be.
Clari and Salesloft closed their merger on December 3, 2025, combining deal inspection, conversation intelligence, sales engagement, and AI-powered forecasting in one platform. Their April 14, 2026 joint release connected Clari's forecasting to Salesloft's execution layer and added a Model Context Protocol server. The integration lets reps create Salesloft tasks and send AI follow-up emails directly from Clari Forecast and Clari Inspect, connecting forecast and deal views to execution rather than keeping them in separate workflows.
Other platforms approach the same process from different positions. Forecastio takes a HubSpot-native approach, bringing both methods into a single workflow to reduce manual reconciliation and the lag between data and decision. Weflow uses rep submissions and stage-level deal signals to surface risk and ground bottom-up forecasts in pipeline evidence without requiring perfect CRM discipline from every rep. Neither approach removes the data-maturity requirement for AI-assisted calibration. Teams still need enough historical pipeline data to set stage probabilities they can trust.
Choosing the right balance for your stage
The weight given to each method should change with data maturity, pipeline reliability, and planning horizon. A new market with no sales history gives bottom-up little to aggregate. A new product line without closed-deal history also has no conversion weights it can rely on. Top-down should therefore carry more weight in those settings, as long as the assumptions behind it stay explicit. Market-anchored estimation is the honest starting point when deal-level evidence does not yet exist.
Annual planning and investor models also lean toward top-down because they look further ahead than the current pipeline can predict. The available deals provide only part of the evidence needed for a longer-term plan. The strategic frame must include revenue from deals that are not yet in the opportunity list, while reconciliation checks that frame against the operating evidence the team has.
For a current-quarter forecast on a mature pipeline, the balance shifts toward bottom-up. Its inputs are easier to trust when stage definitions are consistent across regions, there is enough closed-deal history to calibrate win rates, and teams review opportunities often enough to keep them current. Rep accountability and resource allocation also work better with this deal-level view than with a share of the company target alone.
A team does not earn a dependable bottom-up forecast simply by having a CRM, and adding AI does not manufacture missing historical data. As the data improves, bottom-up earns more influence. As the horizon lengthens or the company enters unfamiliar markets, top-down becomes more prominent. The market and the pipeline keep changing, which means the reconciliation between them is not a one-time exercise. The organization must continually identify which assumptions in the strategic target are absent from the pipeline, and which pipeline realities are absent from the target.
Notes
- Total Addressable Market: How to Calculate TAM, SAM & SOM
Provided the TAM/SAM/SOM framework referenced in the reconciliation section.
- Exploring Approaches to Sales Forecasting: Breakdown vs. Market Build-up • The Tourism Institute
Provided background on the breakdown vs. market build-up distinction that underlies the article's top-down vs. bottom-up framing.